Trenton’s urban heat island: what’s causing such extreme heat?
Trenton is a bustling city at the heart of Mercer County, N.J., known for its lively music, fascinating historical landmarks and many locally owned businesses. Despite its uniqueness, Trenton has one thing in common with every other major city: heat.
Densely populated areas like Trenton are prone to what is known as the urban heat island effect, a phenomenon that explains the rise in temperatures in and around cities that contain a large amount of heat-absorbent surfaces, such as pavement and buildings, according to the U.S. Environmental Protection Agency (EPA).
Because cities often use a large amount of heat-absorbent materials, such as asphalt, concrete and brick, and have a lower percentage of open green space compared to suburban and rural areas, heat can easily get trapped.
“As the densely clustered materials slowly release heat throughout the day and night, it warms the air in the area more than surrounding areas resulting in a local warm spot across the urban area,” said Alex Staarmann, a meteorologist from the National Weather Service’s (NWS) Mount Holly, N.J. office.
Exposure to extreme heat can lead to a number of detrimental health effects, including heatstroke, hyperthermia, worsening of chronic conditions, and in some cases death, according to the World Health Organization.
According to a study that was reported by Statista, extreme heat caused the most deaths related to weather events within the United States in 2021. One of the most effective ways to prevent heat-related illness and death is by providing easy-to-access data about real-time temperatures and heat index values in localized neighborhoods within urban heat island areas. Unfortunately, Trenton currently does not have the equipment or resources needed to do this.
One reason for this lack of data is the limited amount of weather data collection equipment within the city of Trenton. According to Staarmann, the NWS only operates two climate stations near the city: a primary station located at the Trenton-Mercer Airport in Ewing, N.J., and a COOP station located near Hightstown, N.J.
Because these stations are located in very rural, green parts of the county, they do not accurately represent the temperatures and heat index values of the urban center of Trenton. Why can’t the NWS simply install weather stations inside the city?
“Climate network stations are typically not installed in urban areas due to the unrepresentative nature of highly urbanized areas in the climate record,” said Staarmann. “The idea with climate record stations across the country is to keep them in areas representative of the natural surroundings and exposures so that the temperature and precipitation data can be compared more accurately through time and against other stations to monitor trends over the course of years and decades.”
In urban centers such as Trenton, there is such a low percentage of natural surroundings like trees and green spaces that climate data is severely altered when compared to data taken from places with more natural landscapes. Abhilasha Meshram, the communications team lead at Sustainable Jersey City, says that cities need “at least 25% tree canopy cover to counter climate change.”
However, according to a case study by Vibrant Cities Lab, Trenton only has an average of 12.5% tree canopy cover. This means that it is much easier for heat to be absorbed and trapped within the urban center, leading to hotter temperatures during the summer.
Meshram also stated that the lack of street trees and green spaces is an environmental justice issue. The Vibrant Cities Lab case study reported that neighborhoods of color have “around half as much canopy cover as historically white, affluent neighborhoods.”
Tree Equity Score is a website that maps the percentage of tree canopy cover across the United States. Each zone on the map receives a score that is “derived from tree canopy cover, climate, demographic and socioeconomic data,” according to the site.
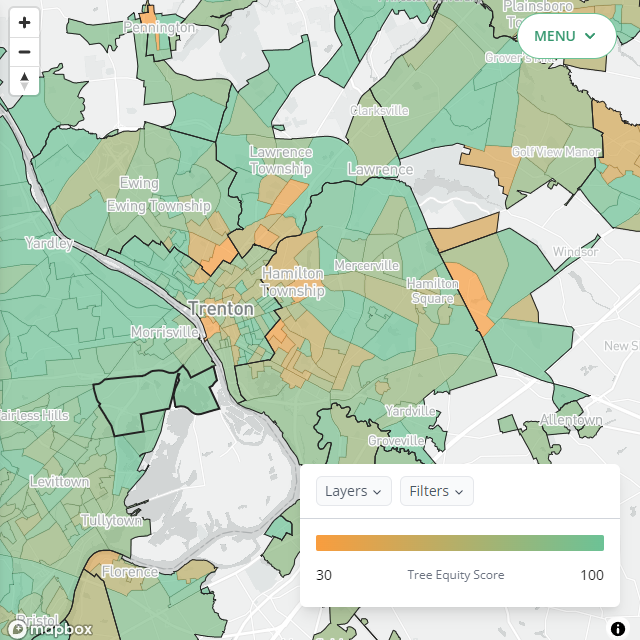
In the Trenton region, the Tree Equity Score map shows a lower score in areas closer to the downtown Trenton area, whereas more rural regions to the north and west have a higher score. This is due to the lack of trees and increased percentage of impervious surfaces and buildings found in the urban center.
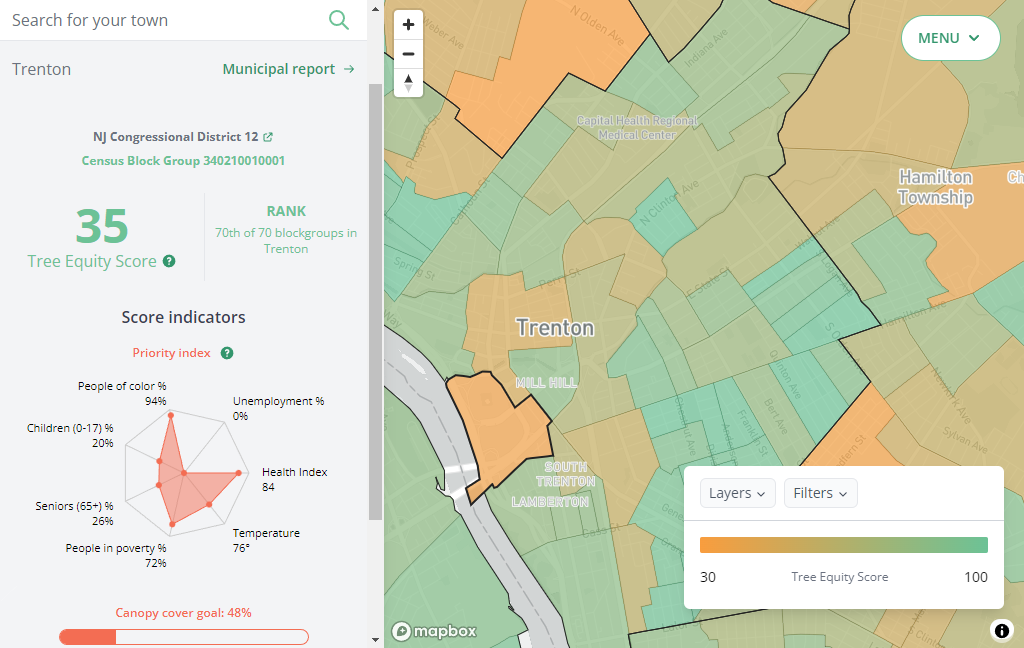
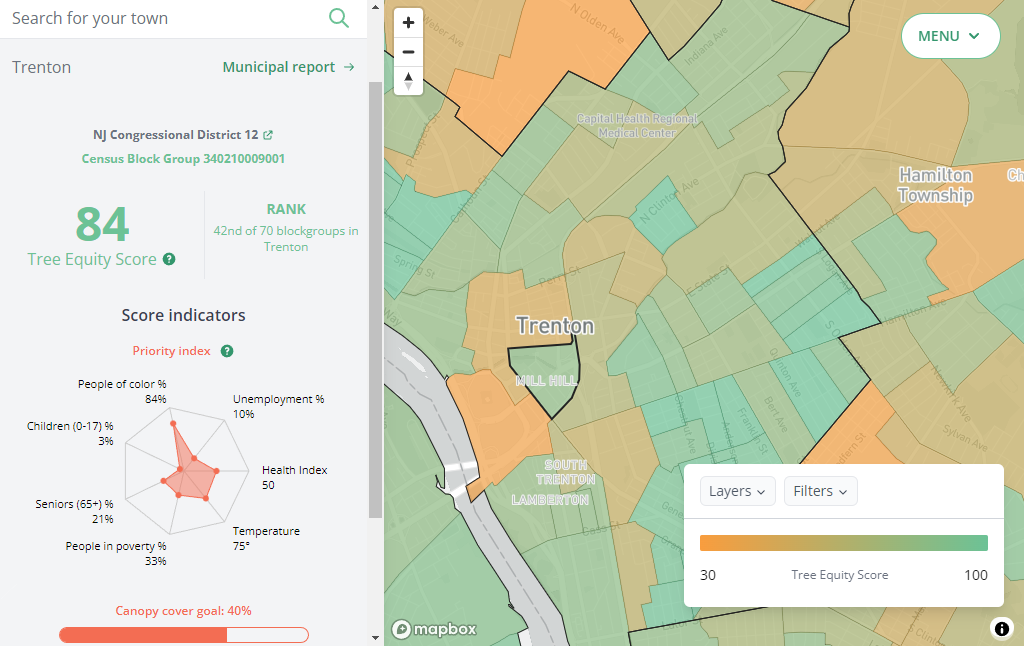
When looking closer at the local neighborhoods within Trenton, there are disparities that can be seen. In the first highlighted district, which received a score of 35, the data shows that there is a higher percentage of people of color and people in poverty living there. In the second district, which received a score of 84, the percentages of both people of color and people in poverty are lower.
This data corresponds with the findings of the Vibrant Cities Lab, showing that neighborhoods of color have a decrease in tree canopy cover, putting them more at risk for extreme heat.
There are a number of ways in which the city of Trenton can address these heat related issues. One method is completing a National Oceanic and Atmospheric Association (NOAA)-funded UHI heat mapping campaign, something that other nearby major cities such as Philadelphia and Jersey City have done. Meshram was a key leader in Jersey City’s heat mapping campaign.
This campaign would send teams of people into local neighborhoods within the city to record climate data such as temperatures and heat index values. This data would then be compiled and interpreted to show which specific neighborhoods within Trenton are most at risk for extreme heat.The help and support of local governments and climate organizations is crucial to effectively addressing the urban heat island effect within Trenton. In Meshram’s experience, “residents benefit most when the goals of state and municipal governments and non-profit organizations are aligned.”
